Orientation
A Short Primer: How the Grid Serves a Large Load#
Readers who work in power systems can skip ahead to Section 1. For everyone else, a few paragraphs on how electricity actually reaches a data center will make the regulatory detail that follows far easier to read. Electricity moves in one direction through the four stages shown in the figure below. Generators — gas plants, wind and solar farms, nuclear units, increasingly batteries — produce the power. Transformers step it up to high voltage, and the transmission grid — the network of large towers and lines that forms the “bulk power system” — carries it long distances. Substations near the point of use step the voltage back down. Loads take it at the end of the chain — historically a home, a factory, or an office; now, increasingly, a data center that can draw as much as a mid-sized city. Because the system connects throughout and electricity resists storage at scale, supply and demand must balance instant to instant, everywhere. When they do not, frequency and voltage drift out of their narrow safe bands, and equipment protects itself by disconnecting — the root of the reliability problems in Sections 4 and 8.
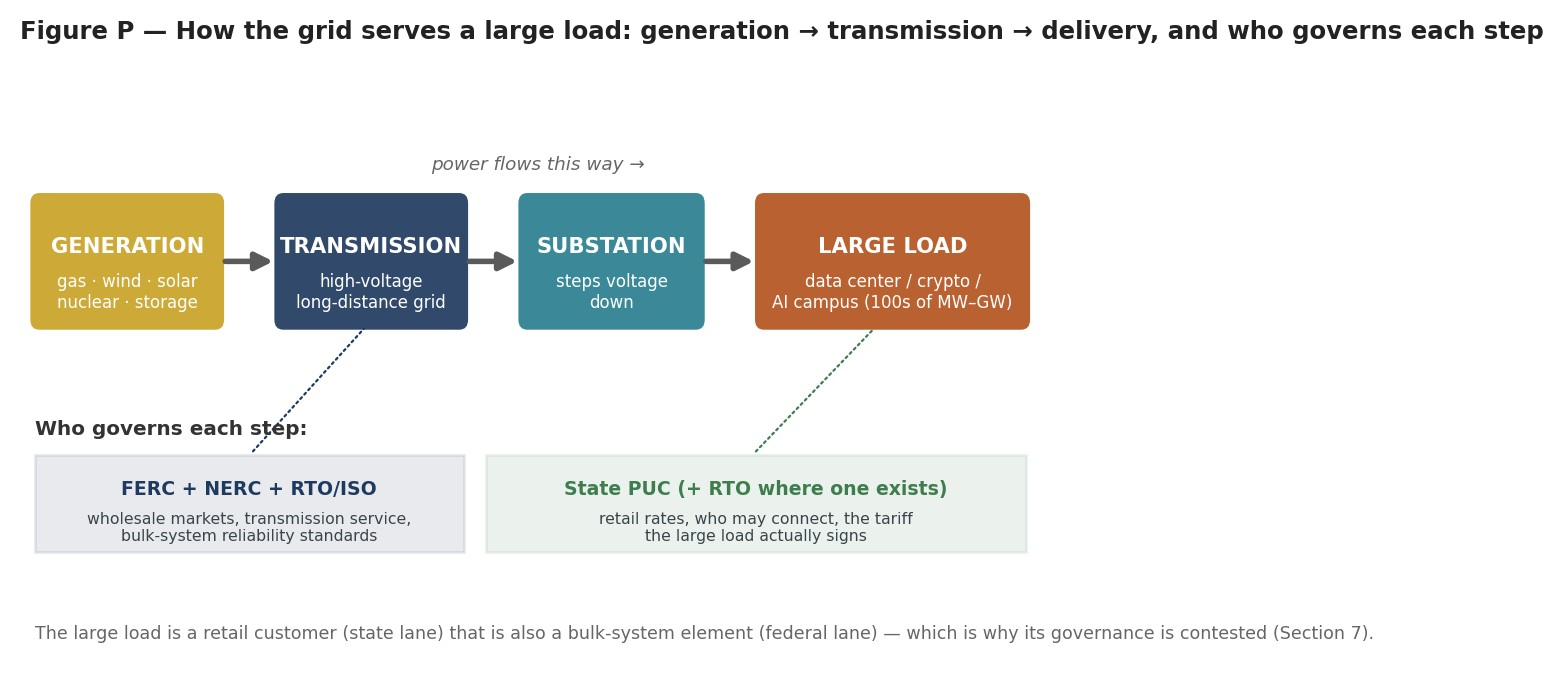
Figure P — The physical chain and its split governance. Power flows left to right through generation, transmission, distribution and load; regulatory authority divides down the middle, with federal jurisdiction over the transmission and wholesale segments and state jurisdiction over distribution and retail service. The division matters because a large load is simultaneously a retail customer and a bulk-system element, so no single authority governs it end to end. Readers should treat the dividing line, rather than any single stage, as the origin of most unresolved questions in this report (Section 7).
Three features explain almost everything that follows. First, the pieces move at very different speeds: a data center takes 18 months to three years to build, new generation about four years, and major transmission seven to ten years. Load can arrive long before the supply and wires to serve it (Section 2). Second, connecting a new large load requires an interconnection study to confirm the grid can serve it reliably, and thousands of pending requests have formed a queue (Section 1). Third, someone has to pay for any new wires and generation the load requires, and someone has to decide the terms of service — and here authority splits. Broadly, the federal government (through FERC and the reliability body NERC) and the regional grid operators (RTOs/ISOs such as PJM and MISO, with ERCOT as Texas's own operator) govern the wholesale markets, the transmission system, and bulk-system reliability; the states, through their public utility commissions, govern retail sales, local distribution, and the tariff a large customer actually signs. A data center sits squarely on that line — a retail customer that is also a bulk-system element — which is why, as Section 7 explains, no single institution has clean authority over it.
Several terms recur throughout. RTO or ISO: the entity that independently operates the grid and the wholesale market for a region. Capacity market: a market that pays generators years ahead to guarantee availability at peak; its prices (Section 3) carry large-load growth through to ordinary bills. Firm service: the grid commits to serve a customer at all times, whereas non-firm or curtailable service costs less and arrives faster but can be interrupted (Sections 6 and 8). Ride-through: a device's ability to stay connected through a brief grid disturbance instead of tripping offline (Section 4). The Glossary at the back defines these and the many acronyms ahead.
One caution on this primer: it simplifies on purpose. The chain above runs in one direction through four stages because that is enough to follow the argument. Real networks are meshed, carry generation on the distribution system and behind customer meters, and have flows that reverse.
Simplifications that only shorten an explanation are left in place. Simplifications that could change a conclusion are flagged where they arise. Two of those are worth stating in advance.
First, a gigawatt of generating capacity is not a gigawatt of firm supply at the peak. The gap is large enough to reverse the apparent adequacy of a build-out, which is why Section 2 explains how the same generator carries three different gigawatt numbers.
Second, national totals average away regional concentration. A figure that looks modest for the United States can be severe in ERCOT or PJM. Where this report gives a national number, it establishes a trend rather than sizing the risk.
Why now: the demand curve, and what is bending it#
For fifteen years U.S. electricity demand stayed essentially flat, growing about 0.1 percent a year between 2005 and 2020 as efficiency gains and the shift from manufacturing toward services offset population and economic growth. Around 2023 that changed.
Retail sales grew 0.8 percent a year on average from 2020 through 2024, and EIA forecasts about 2.2 percent in both 2025 and 2026; its 2026 Annual Energy Outlook records 2.1 percent average annual growth over the past five years — roughly twenty times the pre-2020 rate, and the first sustained increase in almost two decades. Those three figures come from three EIA products measuring three different windows — the Electric Power Annual for history, the Short-Term Energy Outlook current at July 2025 for the two forecast years, and the Annual Energy Outlook 2026 for the trailing five-year average — so the 2.1 and the 2.2 agree rather than conflict. The inflection matters more than the level: planners built their institutions for a flat system and must now serve sustained growth of roughly 2 percent a year — on the order of 90 TWh of additional annual consumption, added each year to a system whose new generation takes about four years to build and whose new transmission takes seven to ten years.
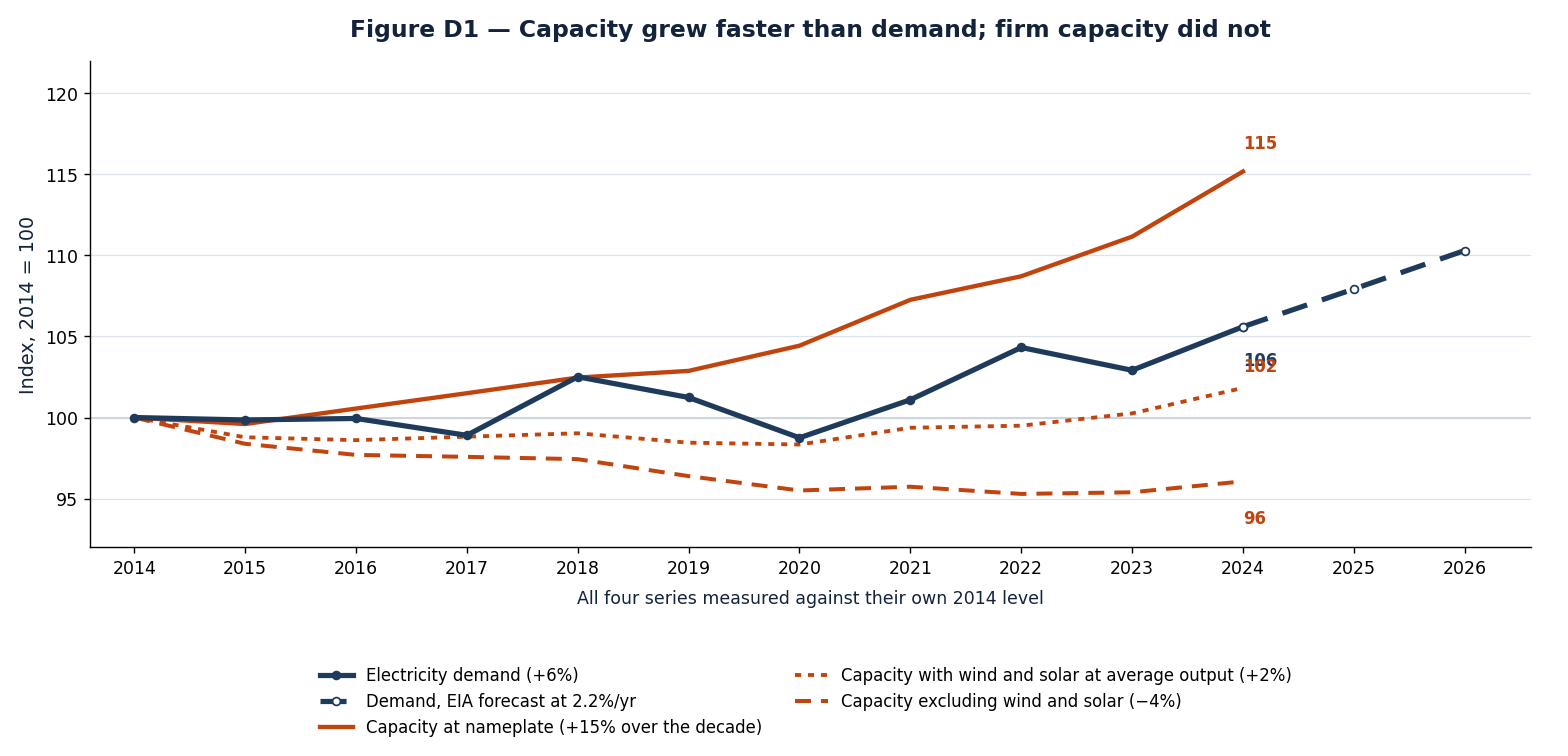
Figure D1 — Capacity grew faster than demand; firm capacity did not. All four series are indexed to their own 2014 level so they can be compared directly — an earlier version plotted terawatt-hours against gigawatts on twin axes, where the lines crossed for reasons of scaling rather than substance. Read plainly: installed capacity at nameplate grew about 15% over the decade while demand grew about 6%, so the system was not running down its margin and no shortage occurred. The concern is what the other two capacity lines show. Counting wind and solar at their average annual output, capacity grew about 2%; excluding them altogether it fell about 4%. Demand growth of 6% across a decade was comfortably served. The forecast 2.2% a year is a different proposition against a firm fleet that has stopped growing. Retail sales from EIA Electric Power Annual Table 2.5; capacity from Tables 4.2.A and 4.2.B; forecast from the Short-Term Energy Outlook.
The sales record shows the change more plainly than any growth rate does. Retail sales moved barely one percent in total over the seven years to 2021, then four percent in the three years to 2024 alone.
| Year | Retail sales (TWh) | Change vs. prior year |
|---|---|---|
| 2014 | 3,765 | — |
| 2015 | 3,759 | -0.2% |
| 2016 | 3,762 | +0.1% |
| 2017 | 3,723 | -1.0% |
| 2018 | 3,859 | +3.6% |
| 2019 | 3,811 | -1.2% |
| 2020 | 3,718 | -2.5% |
| 2021 | 3,806 | +2.4% |
| 2022 | 3,927 | +3.2% |
| 2023 | 3,874 | -1.3% |
| 2024 | 3,975 | +2.6% |
| 2025 (forecast) | 4,063 | +2.2% |
| 2026 (forecast) | 4,152 | +2.2% |
Table D1 — U.S. retail electricity sales to ultimate customers, 2014–2026. Actual years are EIA final annual data; 2025 and 2026 apply EIA’s Short-Term Energy Outlook forecast of 2.2% annual growth to the 2024 base. Single-year swings of two to three percent are weather-driven and routine — the trend is what moved: about 0.2% a year through 2021, about 1.5% a year from 2021 to 2024, and 2.2% forecast thereafter. From 2023, EIA improved its reporting of data center and cryptocurrency mining loads within the commercial and industrial sectors, which affects comparability across that boundary.
Source: EIA, Electric Power Annual, Table 2.5 (retail sales to ultimate customers). Forecast years apply the EIA Short-Term Energy Outlook growth rate to the 2024 base.
National energy consumption is not the appropriate planning metric for this report’s subject, and the table should not be read as reassurance. EIA’s 2.2% national forecast for 2025 and 2026 is composed of roughly 11% a year in ERCOT and 4% a year in PJM against near-flat demand almost everywhere else. Aggregate energy is also the wrong unit: what binds is the coincident peak in a particular place, on a particular network, and whether the wires and firm supply exist to serve it there. Table D1 establishes that the flat era ended. It does not measure the problem.
Data centers drive the headline, though not alone. Grid Strategies and others attribute the surge to four forces at once: AI and cryptocurrency data centers, a reshoring wave of industrial and manufacturing load spurred by federal industrial policy, building electrification (heat pumps and water heaters), and electric vehicles. Data centers dominate the near-term because they arrive large and fast, run around the clock, and cluster in specific localities — which is why their share of national peak understates the strain they place on the particular grids where they land.
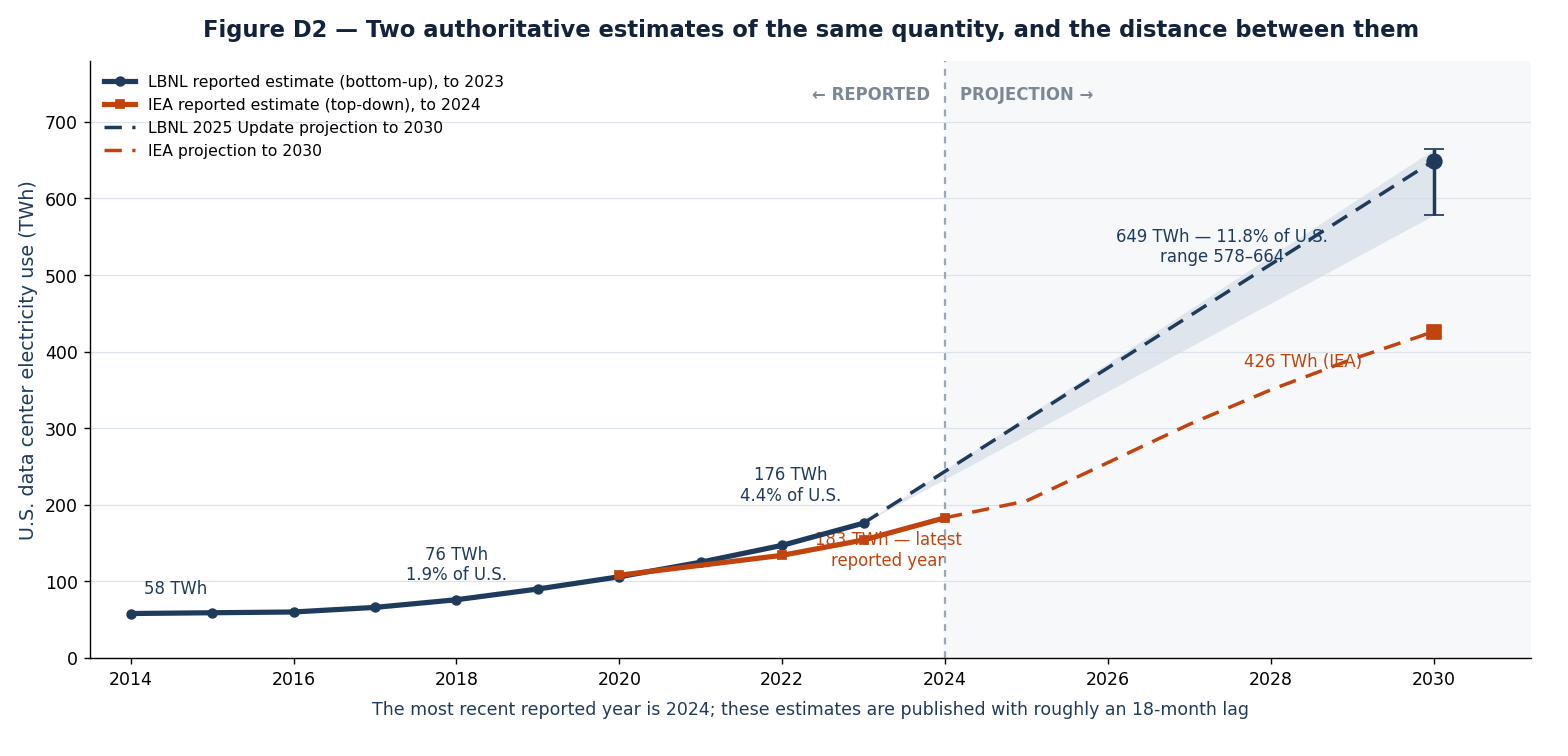
Figure D2 — Two authoritative estimates of the same quantity, and the distance between them. Lawrence Berkeley National Laboratory builds its estimate bottom-up from equipment shipments; the IEA models it top-down. On the reported record they differ by roughly 15% — LBNL puts 2023 at 176 TWh, the IEA at 154 — because they draw the boundary of a data centre differently. Both are shown rather than reconciled, since the gap is itself the finding. Everything left of the 2024 rule is reported; everything right of it is projection. That boundary is worth noting in its own right: at the date of this report the most recent year for which either body has published an estimate is 2024, because these figures are compiled with roughly an eighteen-month lag. LBNL’s 2025 Update puts 2030 at 649 TWh in the reference case, 578–664 TWh across sensitivities, and 11.8% of US electricity within a 9.5–15.3% band. The IEA puts the same year at 426 TWh. Finding: the disagreement between two authoritative forecasts is itself the planning problem. Fifty percent apart, five years out, working from a record that ends two years back — Section 1's difficulty, stated in one chart.