Section 2 of 8
2. Resource Adequacy and the Development-Timeline Gap#
The issue. Even if every queued megawatt were real, the grid could not serve it on the schedule requested, because the three things that must arrive together do not move at the same speed. MISO illustrated the timing mismatch in its January 2026 Large Load Additions workshop: a data center goes from site selection to commercial operation in 18 months to three years; new generation takes about four years; major transmission takes seven to ten years.
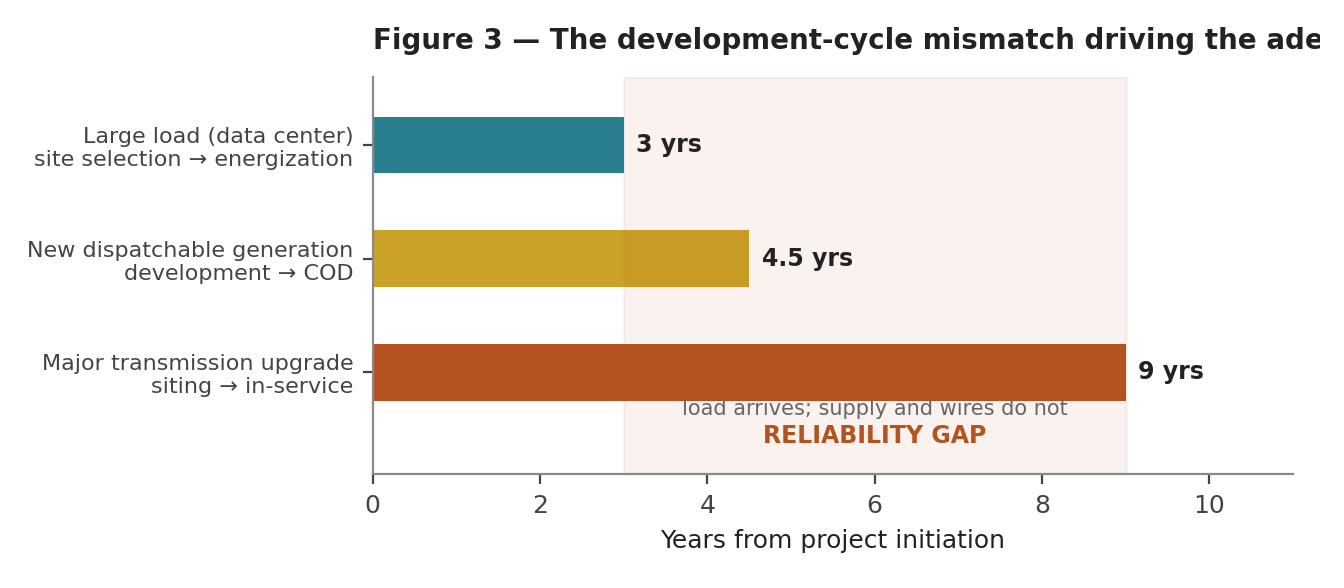
Figure 3 — Development timelines compared: large-load construction against the generation and transmission required to serve it. Load reaches commercial operation roughly three times faster than the supporting infrastructure, and the difference is structural rather than administrative, since it reflects equipment lead times and permitting rather than study queues. The shaded region is where reliability risk accumulates — the interval in which demand is connected and the resources planned to serve it are not yet in service.
Market outcomes are already consistent with this rather than leaving it a theoretical concern. PJM's December 2025 capacity auction for the 2027/28 delivery year cleared at the price cap and still fell 6,625 MW short of the reliability requirement — the first shortfall in the market's history. The 2028/29 auction of July 14, 2026 repeated it at 6,831.3 MW UCAP against a Reliability Requirement of 156,013 MW UCAP, leaving a reserve margin of 14.4% against a 20% target on the results report's own measure; PJM's news release states 14.7%. PJM filed for the backstop on July 31, 2026 in Docket ER26-3380-000, asking the Commission to act by September 29: a one-time procurement of the 6,831.3 MW, on a fixed fifteen-year term, capped at a weighted-average $555/MW-day, with cost allocated to the load additions that created the need. The June 30 design paper had contemplated a September 10 to October 9 window; the filed version opens on September 30 and runs to October 21, conditional on approval, with results in early December. The 2028/29 auction, released July 14, 2026, repeated it and widened the gap: 138,318 MW UCAP procured, clearing again at the cap ($325/MW-day, about 2.5% below the prior cap), roughly 6.8 GW short of the reliability requirement, with only about 525 MW of new generation clearing. Two consecutive cap-clearing shortfalls with negligible new supply reflect the timeline gap appearing in market prices, and PJM's tariff treats a persistent shortfall of more than one percentage point as a trigger for a Reliability Backstop Auction — which moves the backstop below from a discretionary plan toward a mandatory pathway. PJM's load forecast calls for roughly 30 GW of new demand by 2030. In ERCOT, about 23 GW of generation was added across 2024–2025 with another 9 GW expected in early 2026 — real progress, and still an order of magnitude below the queue. Underneath the four-year generation figure sits a harder constraint: the equipment itself. On the order-book evidence below, gas-turbine manufacturing rather than developer demand now appears to be the binding limit. GE Vernova's combined gas backlog and slotreservation agreements reached 100 GW in the first quarter of 2026 (56 GW of it reservations), with near-term capacity effectively sold out through 2027 and delivery conversations now centered on 2029–2030; Siemens and Mitsubishi report comparable multi-year lead times, and large-power-transformer and high-voltage breaker backlogs run in parallel. The “four years” therefore reads optimistically, and the same supply constraints also affect the on-site alternatives of Sections 5 and 8 in a second way: a data center's behind-the-meter turbine order competes for the same slot, at the same handful of suppliers, as a utility's grid-serving order. On-site generation does not step outside the bottleneck — it bids against the grid inside it, and may widen the adequacy gap it was intended to address. (The market-wide view of this dynamic, and its mirror in the queue, is developed at Figure 15 in Section 9.)
Three ways to count a gigawatt#
Capacity figures are quoted in gigawatts, and the same generator has three different gigawatt numbers attached to it. Confusing them is the most common error in reading this data, and it runs in both directions. Nameplate capacity is the maximum output the machine can produce under design conditions — the number in the press release and in EIA’s addition totals. Accredited capacity is how much of that counts toward meeting the system’s peak obligation, set by the operator through an effective load carrying capability analysis: PJM multiplies nameplate by a class rating reflecting how much the resource actually reduces shortfall risk in the hours when shortfall is likely. Delivered energy is the average output across a year, nameplate multiplied by capacity factor — what the resource contributes to total consumption rather than to peak.
| Resource (per 100 MW nameplate) | Counts toward peak (MW) | Average output over a year (MW) | Why the two differ |
|---|---|---|---|
| Tracking solar | 65 | 24 | Output peaks at midday; PJM’s shortfall risk concentrates in late-afternoon and winter hours. |
| Fixed-tilt solar | 50 | 24 | Same annual energy as tracking, delivered in a narrower daily window. |
| Onshore wind | 30 | 34 | Delivers more energy than it is credited for — output is weakest in the summer hours that set the peak. |
| Battery storage, 4–10 hour | 100 | net consumer of energy | Full credit for as long as its duration lasts; it moves energy in time rather than producing it. |
| Gas combined cycle | ≈90–95 | 58 | Dispatchable, so credit is near nameplate less forced-outage history; it runs below capacity for economic reasons, not physical ones. |
| Nuclear | ≈95 | 91 | Runs close to continuously; all three numbers nearly converge. |
Table 2A — Three ways to count a gigawatt. Every figure here states a central tendency rather than a constant. Accreditation varies by region and by year: PJM’s ratings are recalculated annually and ERCOT accredits on a different basis entirely. Average output varies at least as widely — with resource quality and climate at the site, with equipment type and vintage, with how hard a unit is dispatched, and with age, since output degrades over a plant’s life and thermal efficiency falls as equipment wears. A modern combined-cycle unit in a merchant fleet and a forty-year-old peaker share a nameplate rating and almost nothing else. Read the relationships, not the numbers.
Source: Accreditation: PJM ELCC class ratings, 2026/2027 delivery year. Average output: EIA 2025 national capacity factors.
None of the three is the real number; they answer different questions, and the ordering between them is not fixed. Wind delivers more energy than it is credited for, while solar is credited for more than it delivers. A battery is credited at full nameplate but is a net consumer of energy. The 50.5 GW of capacity added across the United States in 2024 therefore does not net against demand growth in the way a single figure suggests: about 31 GW of it was solar, 11 GW batteries, 5 GW wind, and 2 GW natural gas. Against a data center drawing near its maximum around the clock, the question turns not on how many nameplate gigawatts were built but on how many firm gigawatts stand available in the hour the load runs — the quantity Figure D1 tracks, which has not grown.
For scale, U.S. summer peak demand reached about 760 GW in July 2024. Set against roughly 1,230 GW of installed capacity that looks like ample headroom. Set against the 955 GW that excludes wind and solar, and reduced again for accreditation and forced outages, the margin tightens considerably — which explains how PJM’s capacity auctions clear at their cap three years running while national capacity totals rise.
The wires: extra-high-voltage build-out, and the capacity already in the ground#
Transmission is the slowest of the four clocks, and the response to large-load growth has been the first extra-high-voltage build-out in decades. ERCOT is the clearest case. The Permian Basin Reliability Plan, approved by the PUCT in April 2025, authorised three 765 kV lines — the first in ERCOT history — covering roughly 1,255 miles, estimated at $10 to $14 billion depending on scope. Those three paths are being certificated as five segments, which is the unit the paragraph below counts in. The ERCOT board approved the remainder of the Strategic Transmission Expansion Plan in December 2025, and across the full programme the 765 kV element is estimated at $17.2 billion, with a further $4.7 billion of local Permian upgrades and about $11 billion of accompanying work elsewhere — a capital total near $33 billion. The two figures are not alternatives: the smaller covers the three Permian lines alone, the larger the whole extra-high-voltage build. MISO is doing the same thing on a comparable scale: Tranche 2.1, a $21.8 billion portfolio built around a 765 kV backbone across its multi-state footprint, with in-service dates in 2032–34.
The first certificates issued on August 28, 2026, and how they issued matters as much as that they did. The PUCT granted amended certificates for two Oncor segments of the Permian backbone — Dinosaur Switch to Longshore Switch (Docket 59315, 242.6 miles, about $2.24 billion, targeted for 2028) and Longshore Switch to Drill Hole Switch (Docket 59029, 181.6 miles, about $1.70 billion, targeted for 2029) — some 424 miles across roughly thirty counties, and the first 765 kV lines certificated in ERCOT history. The Commission deferred the third item on that day's agenda, the AEP Texas and CPS Energy Howard–Solstice line of about 370 miles, and two further segments remain pending, one of them expected in September. It accepted the administrative law judges' proposals for decision while modifying them on the point the record had turned on: the judges found that Oncor added route links after its June 2025 public meetings, affecting roughly 1,650 additional landowners who received no pre-filing notice, and the Commission disagreed on the law while directing the utility to engage those owners. The chair of the Senate committee of jurisdiction, the Lieutenant Governor and the Attorney General had asked it to defer the programme to the 2027 legislative session instead. Two things follow for this section. A certificate is not a line, and the earliest of these energises in 2028 — still behind the load. And the contested question has moved from whether the wires are needed to whose land they cross, which is a slower variable than either steel or silicon and the one most likely to move the dates. The approvals, mileages, costs and in-service targets come from the utility's own project record; the Commission's reasoning, the deferral and the opposition are from press reporting, since the signed orders are not retrievable through the PUCT interchange.
The dates are the constraint. ERCOT expects the backbone in service around 2031 — the first two certificated segments are targeted for 2028 and 2029 — and MISO its own in the mid-2030s, while the demand they answer arrives now — Permian load alone is projected at roughly 23.7 GW in 2030 against about 11 GW in 2026. Analysis of the ERCOT plan finds the new lines do not materially change zonal imports and exports in the near term, because the west zone depends more on generation built locally than on power imported over the new backbone. This is not an argument against the build-out but the timing inversion expressed in physical assets: the wires answer the 2030s, and the earliest of them answers 2028.
Which is why the more immediate question concerns the capacity already in the ground, and that quantity is now moving in both directions at once. It moves up through grid-enhancing technologies. Static line ratings were set on conservative worst-case weather assumptions, so a line rated for a still 40°C afternoon is carrying far less than it safely could on a windy winter night. FERC Order No. 881 required transmission providers to move to ambient-adjusted ratings by July 12, 2025, and Order No. 1920 requires providers to consider dynamic line ratings, advanced power flow control, advanced conductors and transmission switching in regional planning rather than defaulting to new lines. Full dynamic line rating goes further than ambient adjustment, combining sensors on the conductor with weather modelling and forecasting to set a rating hour by hour; demonstrations have reported capacity gains in the range of 25% and vendors claim up to 40% on favourable lines. Topology optimisation and power flow control add a second lever, rerouting flow around a constraint rather than raising the limit on it. None of this requires new right-of-way, and all of it can be deployed in months rather than years — which makes it, alongside flexible load, one of the few responses that operates on the load’s own timescale.
Machine learning is beginning to appear in the same layer, and the symmetry is worth naming: the technology driving the load is also being applied to the network that must carry it. The applications are unglamorous and mostly concern speed. Contingency screening is a combinatorial problem that planners today address by studying a credible subset; learned surrogates can rank a far larger set quickly enough to shortlist cases for full simulation, which widens coverage rather than replacing the power-flow solution. Topology optimisation — finding the switching action that relieves a constraint — is a search problem of the kind reinforcement learning suits, and several operators have run trials. Dynamic line ratings depend on forecasting conductor temperature from weather, which is a forecasting problem before it is a grid problem. And short-horizon congestion and net-load forecasting feed both the market and the operator directly. Two cautions apply throughout. A learned model that cannot show why it reached an answer is difficult to place inside a planning process built on reproducible, auditable studies, and none of this changes the physics of what the conductor will carry: it finds headroom faster, and finds more of it, but it builds nothing. Set against a queue measured in gigawatts and lines that arrive in the 2030s, this belongs in the same category as the rest of this paragraph — real, deployable on the load’s own timescale, and not a substitute for the wires.
Capability also moves downward, a direction the debate largely omits. ERCOT has reduced System Operating Limits on some interfaces because the sudden loss of a cluster of large loads could by itself cause a violation (Section 4). A System Operating Limit caps the power that may flow across an interface before a contingency occurs, so lowering it removes usable transfer capability from every generator and every consumer that depends on that path — not only from the facilities whose ride-through behaviour created the concern. The effect is the opposite of a grid-enhancing technology and arrives through the same variable. Software and sensors are adding transfer capability; unmanaged load behaviour is consuming it. A ride-through standard is therefore also a transmission-capacity measure, and Sections 2 and 4 are closer to the same subject than their separation in this report implies.
A third case sits between the two directions, and the Crane restart illustrates it. Constellation is returning the former Three Mile Island Unit 1 to service as 835 MW of carbon-free capacity, on a schedule far shorter than any greenfield equivalent in Figure 3, because the plant already stands. The binding constraint proved not to be construction. PJM determined that the 765 kV and 500 kV upgrades needed to deliver the unit’s full output would not finish before December 2030, three years past the 2027 target, and a nuclear unit held below rated output for extended periods carries vibration and wear risks of its own. Constellation resolved the gap by moving 760 MW of Capacity Interconnection Rights from Eddystone, which Department of Energy emergency orders had left running as an energy-only resource, and FERC granted the waiver on June 1, 2026 (Section 5). The lesson generalises beyond nuclear restarts. Where existing capacity can return faster than the wires that would carry it, the binding step becomes an allocation question rather than a construction one, and it resolves on a regulatory clock rather than a supply-chain clock.
Proposed solutions#
- Expedited generation study tracks. MISO's Expedited Resource Addition Study (ERAS) issues a Generator Interconnection Agreement in roughly 90 days for reliability-critical resources, on a quarterly serial basis with a project cap (68 projects, with carve-outs). As of the April 2026 IPWG, the ERAS queue held 53 requests totaling about 27 GW, predominantly LSE-sponsored. SPP runs a parallel process; PJM is developing an Expedited Interconnection Track.
- Expedited transmission review. MISO's MTEP Expedited Project Review (EPR) is the wires-side analogue, intended to move large-load-driven upgrades ahead of the normal MTEP cadence.
- Reuse of an existing interconnection position. Where a plant retires, derates, or runs below the service it holds, the interconnection rights attached to it can serve something else without building anything. Order No. 845 established surplus interconnection service for this purpose in 2018: a new customer may take the unused portion of an existing customer's interconnection service, so that total service at the point of interconnection stays the same, and only up to the level that needs no new network upgrades. The Eddystone-to-Crane waiver of June 1, 2026 applied the same logic across two stations, advancing full deliverability by roughly three years (Section 5). Two limits apply. The instrument reallocates deliverability rather than creating it, which is why PJM's market monitor protested the Crane waiver, and surplus service depends on the original interconnection agreement, so it ends when that agreement does.
- Reliability backstop procurement (PJM). On June 30, 2026, PJM stakeholders approved a two-part backstop plan: LSEs (and potentially data centers directly) request a one-time capacity procurement to cover the projected shortfall, with the procurement's average cost capped at $555/MW-day and billed to large loads. PJM has separately proposed adding roughly 14.9 GW through a mix of bilateral contracts and central procurement.
- Bring Your Own Generation (BYOG). Both PJM (per its January 2026 Board Decisional Letter) and ERCOT are building expedited tracks conditioned on the load bringing incremental generation with it — converting the load from a net drain on adequacy into a roughly neutral or additive one.
- Mandatory resource-adequacy accounting. FERC's June 18 orders required every RTO to file, by July 20, 2026, an informational report explaining how it will ensure adequate generation is available to serve existing and new large loads. That deadline has now passed. Each report was to set out the proposals under consideration in the region's stakeholder process, a schedule of milestones including the expected filing date, and any work under way to accelerate generation additions — which makes the six documents, taken together, the first region-by-region statement on the record of whether the queue can actually be served. MISO's filing, reported the same day, matches its position in the record: a new expedited study process for large loads conducted outside the regular interconnection queue, as the ERAS fast lane winds down, together with a non-firm transmission service option offered in response to the order, against a published target of approval within 120 days once studies are complete and interconnection agreements are signed. CAISO's is the counterpoint, though from a region carrying a fraction of the pressure — its own forecast is 1.8 GW of data-center growth by 2030. It reports that current planning assessments identify no systemic generation-adequacy shortfall comparable to other regions, and attributes that to an integrated framework in which the CEC forecasts, the CPUC orders procurement, and the operator plans the transmission; it does not argue that no further work is required, and commits the additional work to its Large Loads stakeholder initiative. The PJM, SPP, NYISO and ISO-NE filings were not retrievable when this revision closed, and PJM's matters most.
What the pause produced. The abeyance was granted in mid-August, and by the end of the month each of the six had a replacement design in public rather than a defence of its tariff. PJM filed twice: the Reliability Backstop Procurement of July 31 (ER26-3380), and on August 13 an Interim Resource Adequacy Service with a bring-your-own-new-capacity option and a Large Load Registry (ER26-3515), under which a new large load of 50 MW or more at a single site that brings no qualifying new capacity is curtailed ahead of pre-emergency load management, and from the 2029/30 delivery year is excluded from the capacity PJM procures on its behalf. ISO-NE would require new large loads to bring their own new generation and would leave them outside the installed-capacity requirement. NYISO would replace its informational study with mandatory study procedures and require an election between firm and non-firm withdrawal service, the non-firm option carrying a $200/MWh bid cap and automatic curtailment, and would end behind-the-meter netting. CAISO's August 12 straw proposal offers two flexible services — curtailable while upgrades are built and converting to firm, or permanently flexible in exchange for building none — on a calendar ending in a Board vote on October 28. MISO is developing a non-firm large-load service curtailable for reliability but not for congestion, alongside an expedited parallel study for loads of 250 MW and above. SPP's CHILLS took effect on July 1 and a price-adaptive load service is due by November 16. The designs differ in instrument and agree in structure: firm service costs upgrades and time, flexible service is available now, and the election is made by the load rather than by the planner. That convergence, rather than any single filing, is what the show-cause orders have so far produced. PJM's two filings are on the public docket; the other five designs are read from stakeholder materials and reporting of them, and none has been filed as tariff language.