Section 1 of 8
1. Queue Congestion and Speculative “Phantom” Load#
The issue. The large-load interconnection queue has become an increasingly uncertain planning instrument. Unlike generator interconnection, load interconnection historically carried limited standardized transparency, no consistent site-control test, and little financial commitment. In practice, developers shop the same project across multiple utilities, multiple points of interconnection, and sometimes multiple states, and take whichever offer clears first. The queue therefore cannot be read as a direct measure of demand; it reflects a mixture of project optionality and firm intent. ERCOT presents the extreme case. The queue went from roughly 63 GW in late 2024 to 226 GW by November 2025, and to more than 438 GW by mid-2026 — a figure ERCOT itself acknowledges is inflated. Its preliminary long-term load forecast implied a 2032 peak of 367,790 MW, more than four times the historical record, while ERCOT simultaneously told the PUCT that summer 2026 peak would land somewhere between 90,500 and 98,000 MW. Differences of this magnitude limit the forecast's usefulness for long-term planning and suggest that speculative queue entries materially influence the result. The resulting effects include transmission sized against load that may never appear (over-build, stranded cost, ratepayer exposure), capacity markets clearing against demand that has not materialized (Section 3), and genuine projects waiting behind speculative ones.
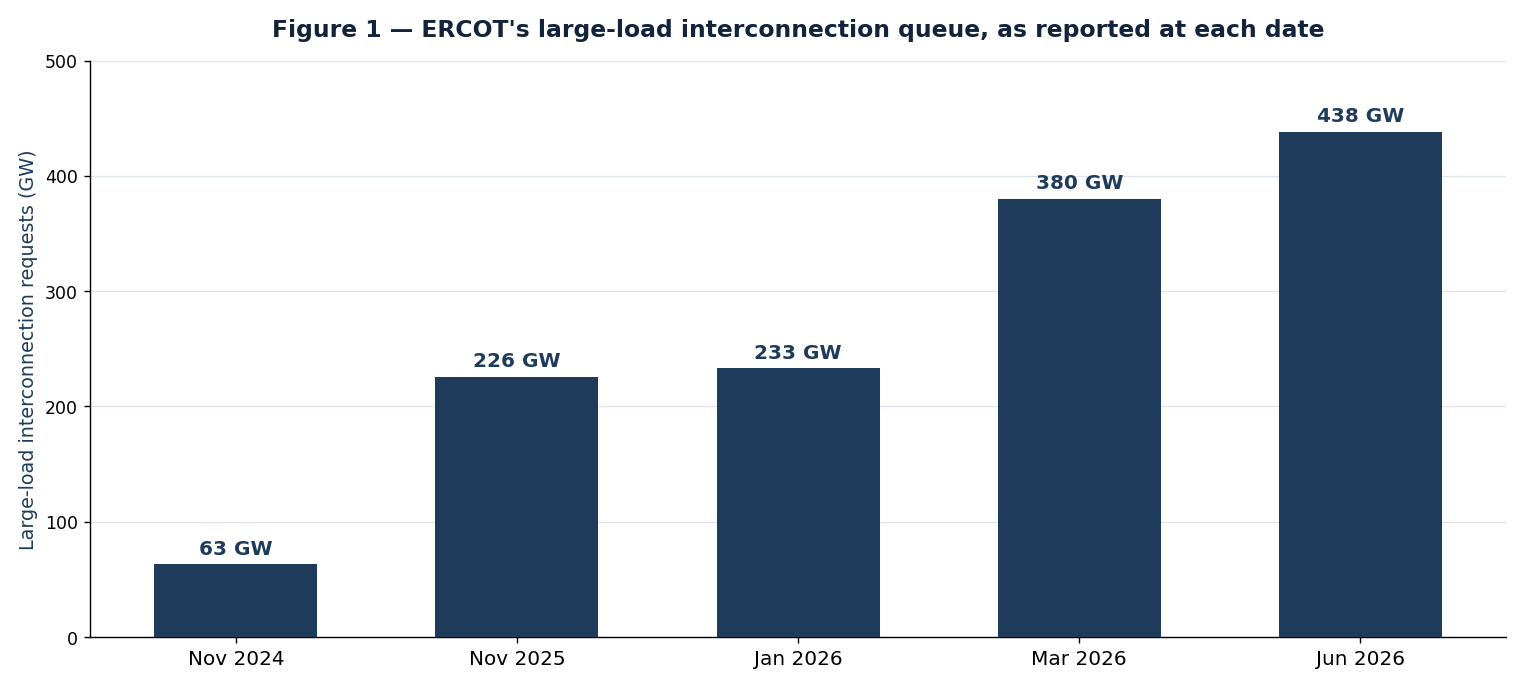
Figure 1 — ERCOT's large-load interconnection queue, as reported at each date. The queue grew roughly sevenfold in nineteen months. Set against it, ERCOT approved on the order of 2.2 GW to energize over the trailing twelve months to late 2025, and about 9 GW had been approved in total by the April 2026 Large Load Working Group — against an observed simultaneous peak near 3.7 GW in March 2026. The gap between requests and energizations is what defines the speculation problem, and ERCOT states that the queue figure carries duplicate and speculative requests, so it indicates pressure rather than demand.
How load forecasting actually works — and why the same queue produces different numbers#
Because so much of this section turns on the gap between a request and a real project, the mechanics deserve specifics. No single method exists. Three families compete, and the choice among them explains why ERCOT and PJM can read similar data and publish forecasts differing by a factor of three. The traditional workhorse is the econometric (top-down) forecast: regress historical system load on weather, calendar, population, and economic variables, then project forward. It holds up for a slowly changing system and fails for a step-change: a 1 GW campus with no history in the data never enters the model. ERCOT and PJM both run econometric base models, PJM using Moody's Analytics economic inputs refreshed in its September 2025 release, and both have had to add something to them.
The second family supplies that addition. The bottom-up, or project-based, adjustment enumerates the actual named projects and weights each by its probability of materializing. The real judgment lives here, and the weighting scheme determines the result. PJM's Load Adjustment Request framework (published July 2025) does exactly this — it solicits largeload additions from each distribution company and reviews every one for significance, likelihood, and doublecounting risk. Utilities inside PJM apply explicit confidence tiers: PSE&G's 2026 filing, for example, counted expansions of existing data centers and new-service requests at 100% but feasibility-stage requests at 50%. The signed interconnection agreement gets full weight; the speculative inquiry gets zero. Texas encodes the same logic in rule rather than practice — after 2026, PUCT Project 58480 admits only large loads with a qualifying executed agreement into the ERCOT forecast.
The third family, still emerging, is the probabilistic or scenario forecast. Rather than a single line, it produces a distribution across many weather, economic, and project-realization combinations. NERC's May 2026 Reliability Guideline explicitly pushes planners toward this — resource-adequacy models that represent firm versus flexible load separately, account for behind-the-meter resources, and reflect AI-training operating windows, evaluated across probabilistic scenarios on a network-aware footprint. It answers a genuinely uncertain queue honestly, and defies explanation to a legislature that wants one number.
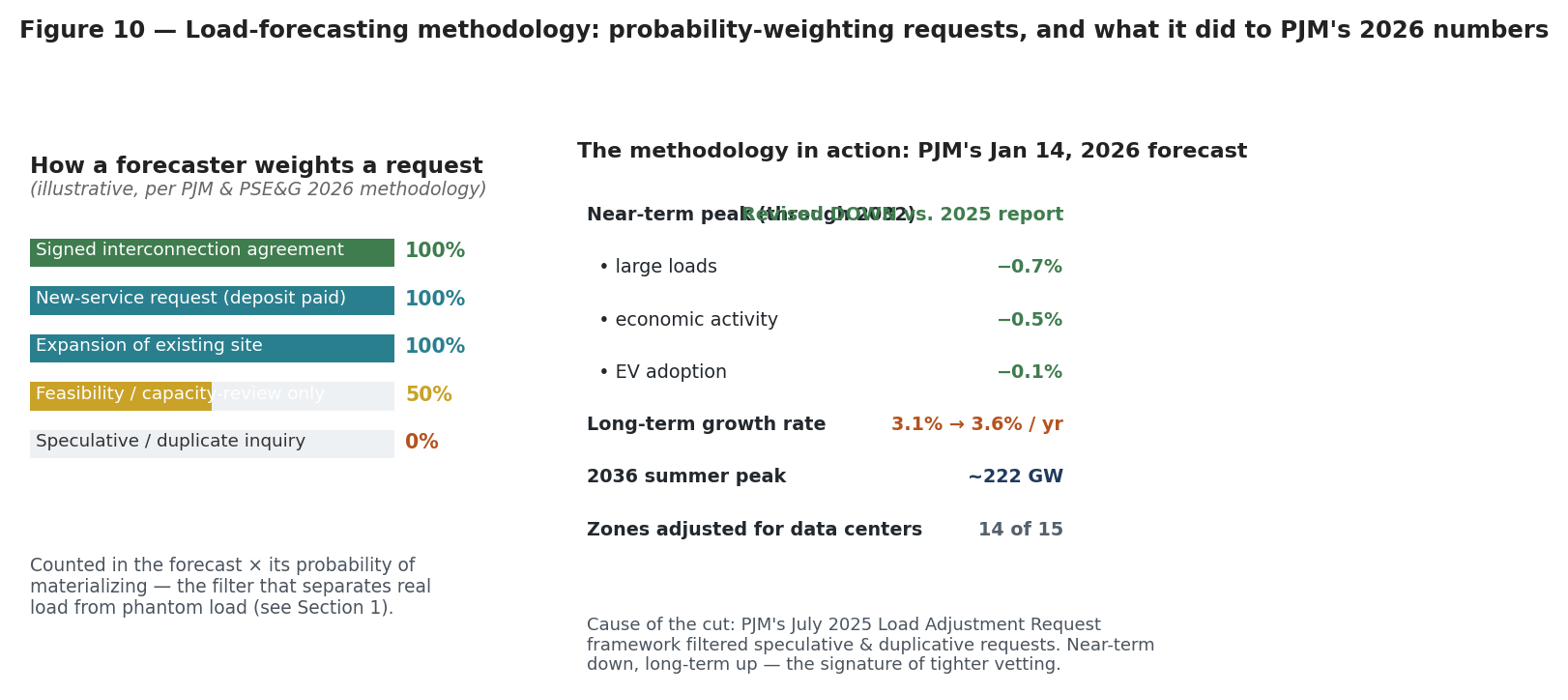
Figure 10 — The probability-weighting step, which separates a forecast from a queue tally. Each request is assigned a likelihood of proceeding rather than counted at full value. The step matters because the same queue can yield forecasts differing by a factor of three depending on how it is weighted. PJM’s January 14, 2026 forecast shows the method in operation: tighter vetting pulled the near-term number down even as the long-term growth rate rose — which is the signature of a forecast improving rather than deteriorating.
The payoff is visible in PJM's own numbers. Its 2026 Long-Term Load Forecast, issued January 14, 2026, revised the near-term peak down versus the 2025 report — large loads −0.7%, economic activity −0.5%, EVs −0.1% for summer 2026 — precisely because the new vetting framework filtered speculative and duplicative requests out of 14 of 15 adjusted zones. At the same time it raised the long-term growth rate from 3.1% to 3.6% per year, to roughly 222 GW by 2036. A near-term revision downward paired with stronger long-term growth marks a forecaster who has stopped counting the queue and started weighting it. NERC's January 2026 Long-Term Reliability Assessment moved the opposite direction at the ten-year horizon, raising projected summer-peak growth by 224 GW — about a 69% jump over the prior year — which is what happens when the long tail of data-center load is finally taken seriously. For anyone reading a forecast, the number matters less than the method: what probability did the forecaster assign to feasibility-stage load, and did anyone check it against the neighboring utility's queue for the same project? Two forecasters with the same raw requests and different answers to that question will diverge more widely than differing weather assumptions would produce. The larger pattern behind all of this is that the forecasts themselves keep moving — and almost always upward. Grid Strategies, aggregating utilities' FERC Form 714 filings, found the nationwide five-year peak-growth forecast rise from about 23 GW (2022) to 39 GW (2023) to 67 GW (2024) on a consistent basis. (Its widely-quoted “128 GW” headline for 2024 is that 67 GW plus roughly 61 GW of further planning-document updates — a distinct, augmented metric, and a caution against comparing numbers that measure different things.) By the 2025 report the aggregate had reached about 166 GW projected by 2030, roughly a six-fold increase over the flat 2022 baseline. That is the macro version of the same story: as data-center load moves from speculative to contracted, it migrates into the official numbers, and each year's forecast rises to catch what the last one missed.
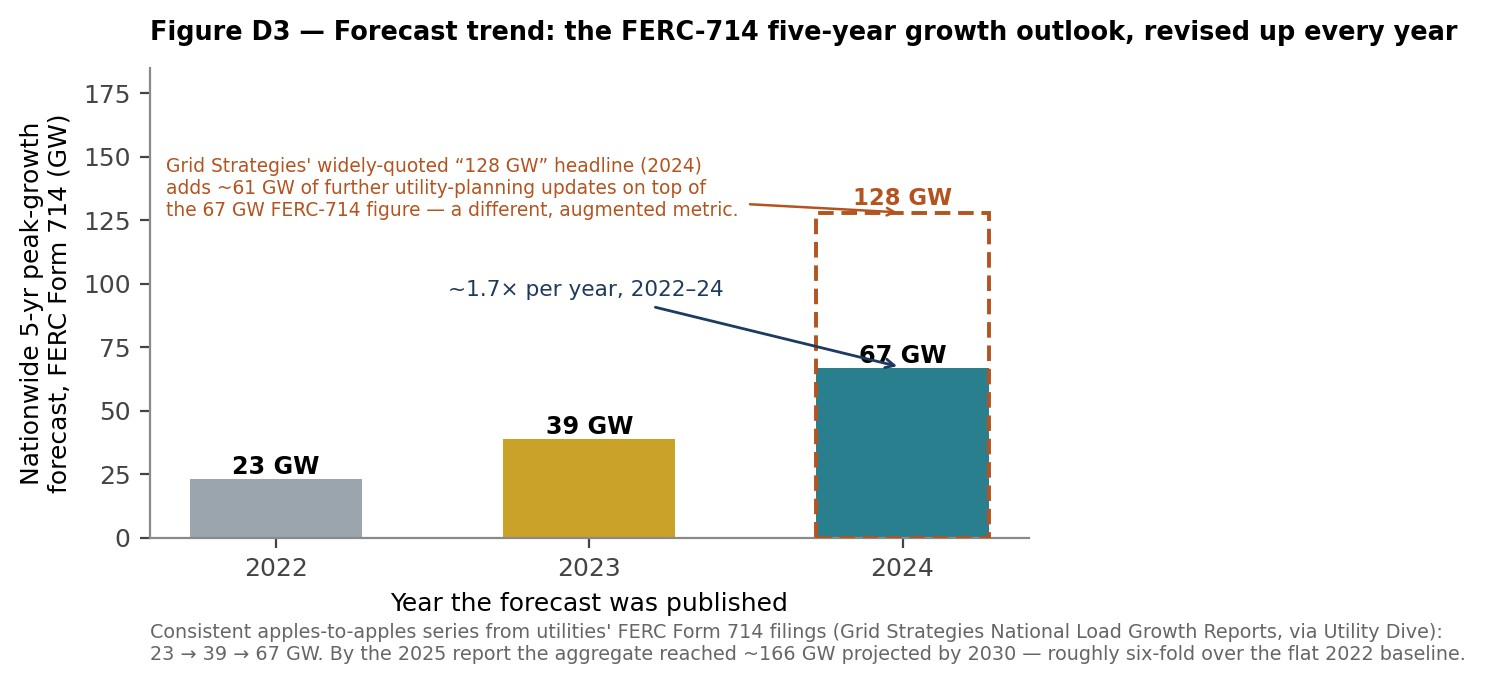
Figure D3 — The forecast trend itself tells the story: utilities' aggregate five-year peak-growth forecast (FERC Form 714 basis) has risen every year as data-center load hardens from inquiry into signed load — 23 → 39 → 67 GW. The dashed outline flags the widely-quoted 128 GW headline as a separate, augmented metric, not a continuation of this series. The risk cuts both ways: the mechanism that under-counted load in 2022 can over-count it now if the vetting (Figure 10) proves weak.
Proposed solutions#
- ERCOT Batch Zero (PGRR145 / NPRR1325), effective July 11, 2026. Replaces the serial, project-by-project Large Load Interconnection Study with a system-wide batch study of all requests ≥75 MW, assessed against a common set of transmission limits. The study sorts loads into base load (studied, agreement executed), studied loads, and not-included. Base-load MW allocation is capped by a 'lesser-of' rule tied to transmission reliability limits, which forces the allocation to reflect physical headroom rather than request volume.
- Batch Zero suspended for verification, August 2026. On August 3, 2026 the Governor of Texas directed a verification of every data-center interconnection request in the state, and ERCOT announced the same day, in Market Notice M-A080326-01, that it would not meet its August 7 deadline to notify transmission and distribution service providers of Batch Zero large-load classifications. ERCOT filed good-cause exception requests on August 10 and the PUCT took them up at its August 20 open meeting. Two workstreams are reported: verification of the attestations behind loads of 75 MW or more already in Batch Zero, where a materially false attestation can remove a project from the study, and a community-impact review of computational loads of 25 MW or more not yet energised. ERCOT has said it aims to file verification results by December 10, 2026, and has acknowledged that the April 9, 2027 study deadline is now at risk. The screen this section describes has been suspended in order to test the population it was built to screen — a different theory of the speculative-queue problem from the commitment pricing used elsewhere, and the first instance of a state executive gating an operator's large-load queue directly. The market notice and the Governor's directive are primary; the thresholds, project counts and the December date are drawn from trade press and law-firm analysis rather than from a PUCT order.
- Financial and site-control gating. PUCT Project 58481 (proposed 16 TAC §25.194, implementing SB6 / PURA §37.0561) sets a 75 MW threshold and requires an Intermediate Agreement supported by documented site control, backup generation disclosure, affiliate/end-use transparency, and financial security proposed at $50,000/MW — roughly 20% refundable at commercial operation. A 500 MW campus therefore posts $25 million to hold its place.
- Forecast gating (PUCT Project 58480, 16 TAC §25.370, effective March 1, 2026). After 2026, only large loads with a qualifying executed interconnection agreement enter the load forecast. This severs the link between speculative requests and planning cases.
- Duplicate-request disclosure. Texas law now directs the PUCT (by December 2026) to require large-load customers to disclose whether they have multiple similar requests under review in the state — among the most direct attacks on double-counting.
- FERC's Category 1 reform (June 18, 2026). Every RTO must justify or replace its application and study process for large-load transmission service, explicitly including readiness screens and alternative transmission technologies.
There is a second route at the same problem that does not run through a tariff. EPRI's framing of why studies take so long is that each flexible project arrives as a custom case, which forces conservative assumptions even where existing headroom would cover it — so the study burden is partly a vocabulary problem. A standard set of flexibility classes lets a customer state capability at application and lets the utility credit it in the study rather than discount it (§6). That is the same trade the five regional designs offer — connect sooner, accept limits — arrived at from the other direction: the Commission is building it into tariffs while the industry builds the measurement layer underneath. Whether the two converge on compatible definitions is an open question and a live risk.